
The Greek countryside is experiencing a depopulation trend, marked by pronounced economic disparities and significant demographic shifts.
The overall population of Greece is decreasing and aging, but the impact on the countryside is more pronounced, and mainland municipalities are grappling with the challenging realities of this phenomenon. Greeks, particularly the older generations, may see nothing new, recalling their experiences in post-war Greece and for decades. Many abandoned their villages to pursue a better future in major Greek cities or through migration.
The Greek countryside’s depopulation, with a few exceptions, persists and may have reached what seems like an irreparable state. Simultaneously with internal (mainly urbanisation) and external migration, aging and population decline pose a more significant threat than ever. Additionally, there are notable spatial differentiations and inequalities.
The maps by the Laboratory of Demographic and Social Analyses (LDSA) at the University of Thessaly (Demographic News: Issue 46, 2023) titled, Demographic Inequalities and the National Action Plan, paint a challenging future for Greece.
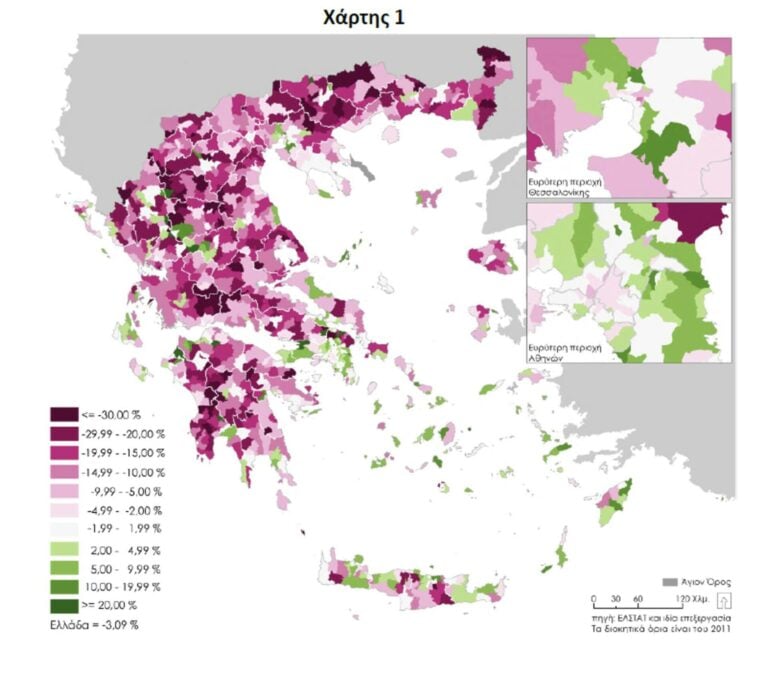
Concerning the number of residents by location over the last decade (Map 1), a clear dominance of pink to deep purple indicates a decrease. Only the broader region of Attica, Thessaloniki, some areas of mainland Greece, parts of Crete, and a few islands in the Cyclades, the Dodecanese, and the Ionian remain green. The picture is even more “red for births,” with aging becoming yet another significant and substantial challenge.
In an article titled Demographic Inequalities and National Action Plan, Professors Vyron Kotzamanis and Vasilis Pappas shed light on a critical issue Greece must urgently address – the convergence of ‘aging’ and ‘super-aging’ in more than one-fourth of its regions.
Their research, conducted within the framework of the ELIDEK-funded program Demographic Agendas in Research and Practice in Greece, suggests that by 2050, a group of regions will have over one-third of their population aged 65 and above, with a quarter of them classified as ‘super-elderly.’
Highlighting the significance of addressing demographic challenges promptly, the Kotzamanis and Pappas call for adaptation to expected changes and policies to reverse the trend and mitigate adverse effects. While acknowledging recent government announcements, such as the proposed National Action Plan, the authors stress that such a plan should consider the overall components of the ‘demographic’ and significant existing spatial differentiations.
The professors argue that the public discourse has primarily focused on national-level developments, neglecting substantial differentiations around national averages at lower levels.
Below are four examples that underscore spatial differentiations in Greece to support their argument.
Spatial Variations
1. Highly Unequal Population Distribution
Based on recent census data (2021), the researchers note that 50 per cent of GReece’s population occupies just 4.3 per cent of its territory.
Furthermore, 80 per cent of the population resides in 25.2 per cent of the territory. This indicates a significant concentration of people in specific areas, a trend notably different from the situation in the early post-war decade.
2. Population Change Disparities
Analysing population changes between 2011 and 2021 (see Map 1), the professors find that the country’s permanent population decreased by 3.1 per cent. Delving deeper into this change across 1,035 Municipal Units (D.E.), they observe a range of fluctuations from -33 per cent to +19 per cent. Notably, in 62.5 per cent of these units, the population decreased by more than 5 per cent, with half experiencing a reduction exceeding 10 per cent, and one-fifth witnessing a decrease of up to 20 per cent.
The authors underscore the need for a nuanced approach that considers the regional nuances, urging policymakers to recognise the substantial spatial variations when formulating strategies and action plans. The researchers also stress that Greece’s demographic landscape has evolved significantly since the first post-war decade. Political parties, social entities, professional bodies, and the public are showing an increasing interest in current developments and the future demographic trajectory.
In their comprehensive analysis titled Demographic Shifts and Population Aging Trends, Professors Vyron Kotzamanis and Vasilis Pappas explore critical aspects of Greece’s demographic landscape, focusing on natural balances and population aging. They expressed concern over the potentially explosive combination of ‘aging’ and ‘super-aging’ in more than a quarter of the country’s regions, highlighting the urgency of addressing these challenges.
Natural Balances (Births-Deaths)
Examination of the ratios of deaths and births the authors present a stark contrasts across various regions.
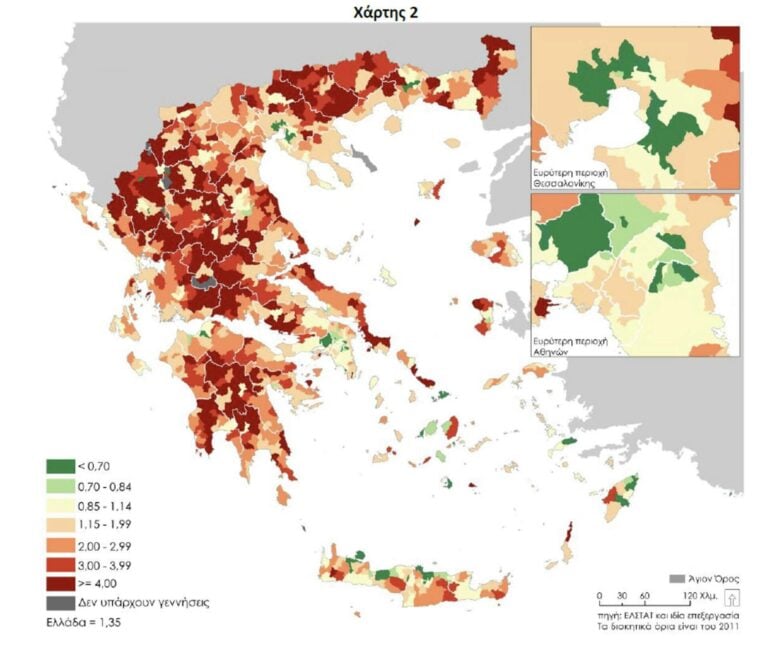
1. National Perspective (Map 2)
From 2014 to 2019, at the national level, there were 1.3 deaths per birth. At the municipal level (D.E.), the ratios varied from 0.5 deaths to over 16 deaths per birth during the same period.
In 11 per cent of D.E., there was one death per birth, while in 7 per cent, there were fewer deaths per birth (fewer than 85 deaths per 100 births).
2. Regional Disparities
In 38 per cent of D.E., more than three deaths per birth were recorded and 25 per cent(1/4), more than four deaths per birth were noted.
In 18 per cent, more than five deaths per birth were documented.
Population Aging
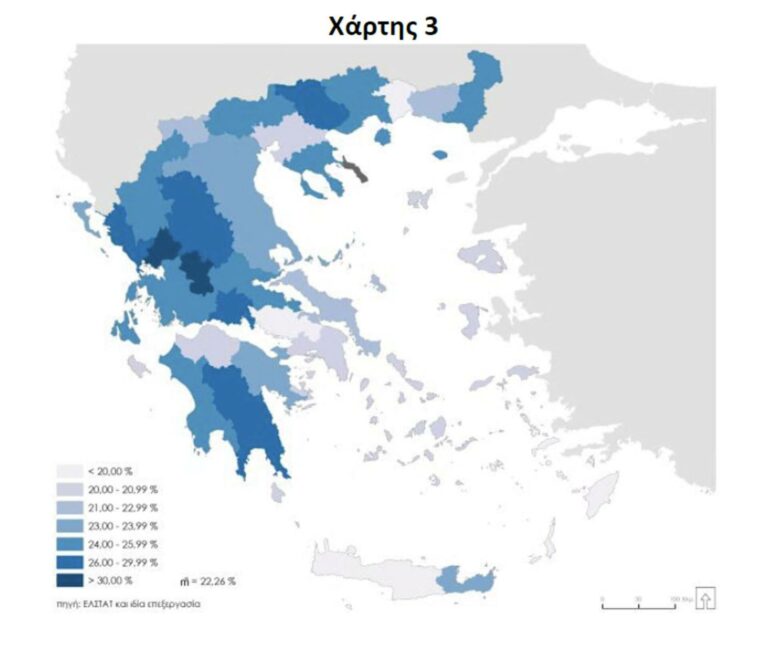
Regarding population aging, the professors clarify: According to ELSTAT estimates (2020), at the national level, the percentage of those aged 65 and above is 22.5 per cent, while those aged 85 and above constitute 3.6 per cent.
However, beneath these national averages lie significant variations (Map 3), with ten regions leading the way, surpassing 28 per cent. Two even exceed 30 per cent, surpassing the expected national average for 2050 (30-31 per cent).
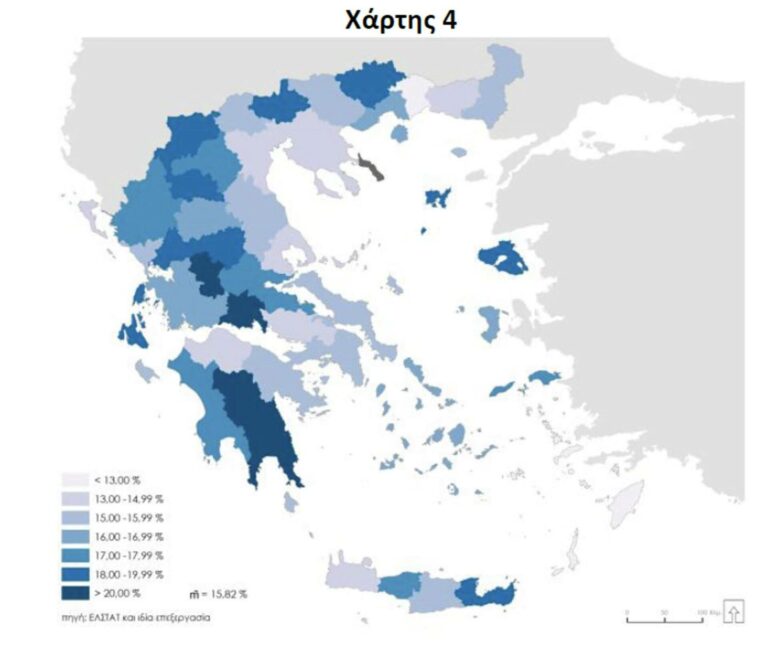
Aging Within Aging (Map 4)
Examining the specific weight of those aged 85 and above among those aged 65 and above (individuals aged 85+ per 100 individuals aged 65+), the professors reveal another dimension, “aging within aging.” In 2020, at the national level, there are slightly less than 16 individuals aged 85+ per 100 individuals aged 65+.
In 15 regions, with a population approaching one million in 2020 (9 per cent of the total population, covering 25.5 per cent of the territory), more than 18 individuals aged 85 and above per 100 individuals aged 65 and above are reported. In four regions (Laconia, Arcadia, Phocis, and Evrytania), this figure exceeds 20.
Implications and Future Challenges
The professors warn that if Greece’s population decreases by several hundred thousand to over 1.5 million by 2050, with one-third aged 65 and above, the decline rates will be much higher in a significant part of the rural areas compared to metropolitan regions like Athens and Thessaloniki.
Without immediate measures, this could lead to further depopulation in many municipalities and accelerate aging, resulting in higher death rates per birth.
Even efforts to increase fertility rates may not suffice, as the absence of young populations will hinder birth rate increases, aggravating the impact of rising deaths and aging. No matter how positive, migration patterns are unlikely to halt this declining trajectory, carrying significant implications for these regions and beyond.


